Mastering Telemetry in a Legacy .NET Project
TL;DR Jump to practical examples ➜
A few words about me: in my work I try not just to develop features, but to solve underlying problems that slow down development as a whole.
One day, a former colleague reached out and offered me a chance to join his company as a team lead. I had always wanted to test myself in this role, so I gladly accepted.
To get familiar with the real issues, I first joined the support team and was asked to find ways to reduce costs.
A few words about the project:
- a large, old system
- heavily based on Microsoft technologies
- the core process: data aggregation and ETL
What I discovered
Every day started with incident analysis.
The team was very efficient at it: a few long-time specialists knew exactly which parts of the system caused trouble most often.
Developers mainly relied on logs and server metrics.
If servers stopped or used too many resources, they would catch it quickly and dig through logs.
For experienced members, this was usually enough — they knew the system well.
But new developers often got lost, and even experts still spent time investigating and writing up root causes.
In short: it worked, but it cost time and money.
As a fresh pair of eyes, my first thought was clear:
✅ We need proper telemetry.
Good telemetry would help new developers:
- see how the system is structured,
- understand what components exist and how they interact,
- and quickly see where problems come from.
With that in mind, I started designing a practical solution.
My starting point and choice of tools
I had worked with telemetry before. On one large project, I used New Relic — it was powerful, but for this company it wasn’t a good fit: they prefer to rely on their own infrastructure and hardware.
They do have a Kubernetes cluster, but few specialists to maintain it, and it’s not yet fully used in production.
On another project, I had used Jaeger and liked it. It was easy enough to run and works well with the OpenTelemetry standard.
From my experience, sticking to open standards is always the safest choice. It’s better to use two components from different vendors that follow the same standard than to get locked into a single vendor’s ecosystem — I learned this the hard way with OpenID and Auth0.
So for this project, I decided:
- Not to spend time setting up Kubernetes.
- Instead, run Jaeger in Docker on a Linux server.
- Use the OpenTelemetry SDK in the .NET applications for integration.
This way, the setup stays simple, works with existing infrastructure, and remains flexible for future changes.
Architecture and Iterative Improvements
When designing serious systems, it is always better to start on paper. Even if mistakes are made, it is much easier (and cheaper) to fix a sketch than to rework a live system. Another critical point is documentation. On one of my projects, we made it a standard practice to write a short RFC for every substantial change. For my initial proof of concept, I skipped the docs, but as soon as it became clear that the task was complex, I wrote documentation to formalize my thoughts.
In my experience, the best practice is to keep documentation as close to the code as possible. This works especially well in a monorepo. Documentation should be clear enough that any new developer encountering the system can understand its purpose and flow without long handover meetings — this directly reduces IT business costs.
My typical RFC skeleton looks like this:
- Problem description
- Proposed solution
- Alternatives considered
- Open questions
Depending on the task, I might add extra sections — for example, a snapshot of the current state if I’m planning to improve an existing component.
Equally important is not just to describe what was built, but to explain why it was built that way. This helps others trust the decisions and extend them safely in the future.
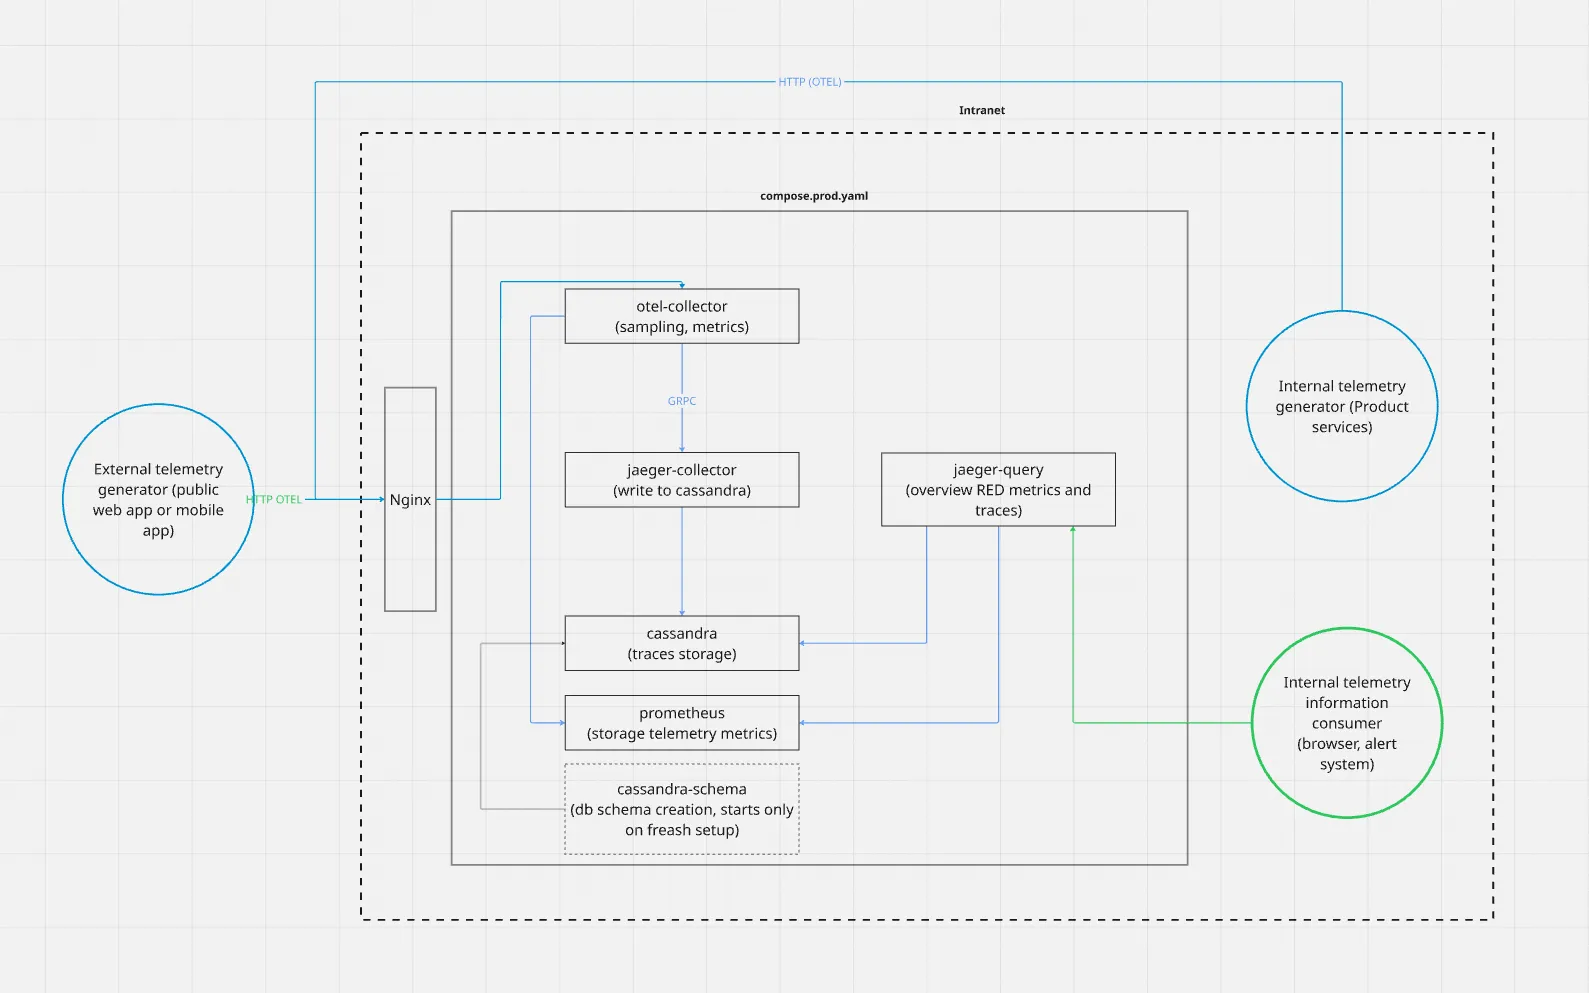
Real-world telemetry setup
Returning to the telemetry topic — the final version of the architecture looked quite simple but was built iteratively with these principles in mind. One significant change was made early on, but the end result was robust: it could handle up to 160 GB of telemetry data daily and store it for 2 days, running entirely on a single server with 4 GB RAM, 500 GB disk, and 4 CPU cores.
The main challenge turned out to be disk usage. As more services integrated with the collector, the volume grew fast — so keeping storage under control became the key constraint.
Example RFC
I won’t include the full real RFC here 😉 — you can find good examples in many open-source repositories:
Keycloak RFC example
Jaeger RFC issue
Vitess / Postgres-style design RFC
The goal is not just the format, but the discipline: sketch first, write an RFC second, then implement and refine. Of course, this documentation should be reviewed by other experts on your team — just like real implementations.
Development approaches
One of my core principles is developer convenience.
For me, this means everything in the repository must run with minimal effort. Docker helps a lot with this: of course, a production server can never look exactly like a developer’s laptop, but you can get it close enough — and make deployment dead simple.
I followed this principle from day one. Even if the rest of the system needs manual tweaks or tribal knowledge, your own corner of the codebase should be green, clean, and predictable.
In practice, this means:
- If your service is basically a
docker-compose.yml, thendocker compose upmust Just Work™. - This saves time: instead of changing things directly on the production server, I could test everything locally first, then push updates with confidence.
- Even without formal Infrastructure as Code, you can apply the same discipline manually — it pays off quickly.
Make it easy for others to help
Everything needed to build and test your component should be ready in the repository.
This way, you can easily ask teammates for help, and they won’t waste hours just trying to run your code.
Unfortunately, many legacy projects fail at this basic rule.
Problem investigation: real examples
On this project, I had help from one senior developer and a junior DevOps engineer. Together, we tackled a few interesting challenges — let me share how.
1) The dependency problem
In one of the past projects with telemetry, an architect had used the OpenTelemetry SDK — but for some reason, he just copied its source code directly into the project instead of installing it as a proper dependency.
At first, I couldn’t understand why, but once I started using this SDK myself, the problem became clear: the SDK depends on very recent .NET packages, which often conflict with older packages, like Entity Framework 6.
Luckily, in our case, only a mock library for EF was causing a conflict.
Once I reproduced the issue and showed it to the other developer, he quickly found a solution.
Resolving complex dependency conflicts is always tricky — sometimes the best approach is to build your dependencies manually, picking only the pieces that won’t break your project.
2) The storage problem
In this setup, we used Cassandra because it supports TTL out of the box — metrics older than two days should auto-delete. In theory, this should have solved the problem. But in practice, the server kept stopping.
Our DevOps tried to clean up the storage manually and tune Cassandra to handle it better, but after a while, he gave up — and we all drifted into guess-shooting again.
When you catch yourself doing that, it usually means you don’t have enough information yet and need better tools.
So I added proper metrics to Cassandra.
Once I had them, it became obvious that the server always stopped right before the TTL would clear the data.
I paused data collection, checked how much space was truly needed for stable operation, and once we added enough disk space, the issue disappeared.
3) Trace fragmentation
Another subtle but important challenge was trace fragmentation.
In theory, all services should pass along the same trace context so that you can see the full story of a request, from the API gateway down to the database.
In reality, this works well when services share common ASP.NET startup code — but in legacy projects, there are always exceptions and customizations.
In my case, I had a mix of Windows Services and a few old Web Services.
For Windows Services, I needed to implement proper span creation for scheduled jobs. I used the .NET Activity API — it works well and avoids spreading OpenTelemetry SDK dependencies all over the codebase.
For the legacy web service, it was enough to bring its startup flow closer to a typical ASP.NET configuration — once that was done, context propagation started working out of the box.
4) CORS handling
A monitoring service should be able to start and collect telemetry even if the main application services are down.
To make this possible, I exposed a dedicated endpoint for client-side telemetry collection.
However, browsers enforce strict security rules that block requests to hosts other than the web app itself — the classic CORS issue.
Originally, the project had a proxy controller in the backend to work around this.
I suspect the developer who added it simply ran into CORS problems and solved it that way.
In my final setup, I handled CORS directly at the Nginx level.
Think of Nginx here as an ingress controller in Kubernetes terms — it’s a good place to terminate CORS and handle routing.
My local Docker setup made it easy to experiment with CORS configurations before deploying to production.
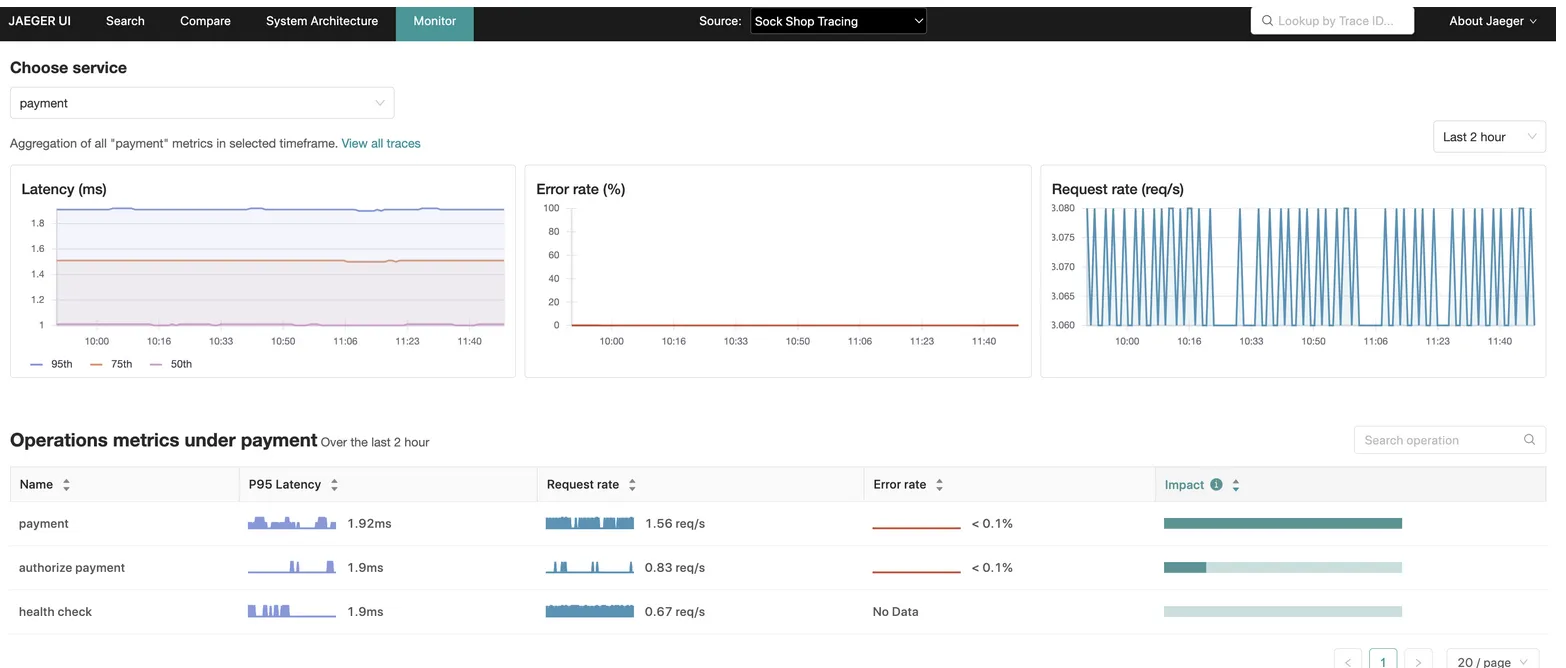
5) Aggregated telemetry statistics
Once you have tracing working, you quickly realize that just traces are not enough — you also need a clear monitoring panel for high-level stats like RPS, error rates, and so on.
For this, I used Jaeger’s built-in tool called SPM.
However, it turned out to be quite tricky to configure correctly: basically, you need to run and combine two collectors to make it work as intended.
In my experience, this complexity exists partly because Jaeger was not originally designed with the full OpenTelemetry standard in mind. From what I’ve seen, the project seems to be split between the original Jaeger Authors and the broader Linux Foundation governance — but don’t take this too seriously, it’s just my personal guess. 😄
Despite this, Jaeger remains a very good and reliable tool — and once set up, SPM provides helpful aggregated stats alongside detailed traces.
6) Authorization
Luckily, I had access to a corporate authentication server, so the infrastructure team handled most of the effort for me.
However, it’s important to know that Jaeger does not have built-in authentication out of the box.
If you need something simple, it’s usually best to add basic authentication on top of Nginx.
I did exactly that when my setup wasn’t yet integrated with the company’s infrastructure — it worked well enough to keep the telemetry endpoint protected until a full single sign-on was ready.
So these were the main corner problems I faced. I hope sharing them will help you set up telemetry in your own projects with fewer surprises.
Key takeaway
Whether it’s local dev setup or production tuning — clarity and simplicity always pay off.
A clean local environment, clear documentation, and good observability reduce surprises and make teams faster and more confident.