Jaeger Docker Setup: Production-Ready Tracing Server
TL;DR https://github.com/zloom/telemetry
On one of my recents projects I needed a simple and reliable way to handle telemetry in a legacy .NET project.
No Kubernetes. No big team. Just me — and a minimal server.
Most mature teams run observability stacks in Kubernetes or pay for SaaS services like New Relic or Datadog.
But if your project is small, Kubernetes might be overkill, and SaaS might not fit your budget or privacy requirements.
I had worked with Jaeger before — it’s a solid tracing solution, especially when paired with the OpenTelemetry standard, which is now supported almost everywhere.
Jaeger does provide a sample Docker setup — but in newer versions it’s an all-in-one container with in-memory storage, which isn’t production-ready.
Older versions (like 1.63) include SPM (Service Performance Monitoring), but they still use all-in-one mode.
To make it production-worthy, you need to combine Jaeger with the OpenTelemetry Collector, which takes some work.
And on top of that, you have to solve CORS, SSL, and proxy issues when collecting telemetry from web apps — and don’t forget about Cassandra metrics.
This setup solves all of that.
It’s designed to be robust, minimal, and easy to run — even on a modest VPS.
Server overview
Each service individual files located in corresponing subfolders. Once you run it you will have components state for example cassandra data files wich may be huge this will appear in data subfolder with service name (data/cassandra for exampe).
The only config you need to update to raise server is is caddy DOMAIN
...
caddy:
    <<: *logging_default
    container_name: telemetry_caddy
    build:
      context: ./caddy
      dockerfile: Dockerfile
    environment:
      DOMAIN: localhost
...
I dont reccomend to remove x-logging_default mixin, i reduced verbocity in cassandra but components may still generate huge amount of logs so your server may be oveflowed with docker logs.
This have to match with your server public endpoint something like my_telemetry.io’ then https://my_telemetry.io/v1/traces would be your OTEL_EXPORTER_OTLP_ENDPOINT for exporting telemetry from apps.
Once you assigned dns properly you can start server with docker compose up -d caddy will obtain letsencrypt sertificate automatically, if you run it with localhost DOMAIN it will generate selfsigned sertificate. There is also compose.dev.yam you can run this setup with docker compose -f compose.yaml -f compose.dev.yaml up -d then trace generator will be added to your setup, this usefull if you want to test setup. Server paths are configured as following domain/jaeger-query is jaeger builtin trace explorer and SPM. domain/prometheus is prometheus. I not reccomend to change service version as services are tested againts each other, something may stop working 💥
Server components overview
Let me explain the role of each component.
Caddy
A lightweight web server — handles SSL, CORS, and exposes both public and internal endpoints. Configuration is in caddy/Caddyfile.
Originally I tried using Nginx, but it’s not a great fit for Docker setups. Certbot integration for SSL is too complex, and Nginx doesn’t resolve service names properly inside Docker. You can still use it, but I recommend keeping it outside the container network.
Jaeger Collector
Jaeger’s trace collector. It accepts only filtered traces from otel-collector and writes them to Cassandra.
Ideally, the otel-collector should write traces directly, but the public image otel/opentelemetry-collector-contrib doesn’t support Cassandra. To eliminate the Jaeger collector, you’d need to build a custom Otel Collector image — so there’s room for improvement here.
Jaeger Query
The main Jaeger UI — includes both the trace viewer and SPM (Service Performance Monitoring) panel. It depends on Cassandra and Prometheus.
If your project already uses Grafana, it might make sense to replace this with Grafana dashboards.
Otel Collector
The telemetry collector. It receives distributed traces, handles tail-based sampling, and generates trace metrics. It forwards traces via gRPC to the Jaeger Collector and exposes metrics for Prometheus.
In this setup, I use tail sampling, meaning the decision to keep or drop a trace is made server-side. Exporters just send everything.
Tail sampling is heavily promoted by the OpenTelemetry team. Jaeger developers still support head and remote sampling, but these require a two-way connection and real-time configuration sync, which makes the whole system more fragile. Also, many exporters don’t support this because it’s not part of the official spec.
That’s why I prefer sticking to the standard. Simple and reliable beats complex and fragile — unless you have very specific requirements. Public standards also help avoid vendor lock-in.
Sampling is the main way to control server load, along with disk size and retention period. In this setup, the rules are:
- Always keep
ERRORtraces - Keep 90% of all other traces
- Wait 5 seconds (
decision_wait) before deciding
If you’re adding telemetry to your services for the first time — don’t enable sampling immediately. Record all traces first to check trace quality. For example, you might not record errors properly yet — and that would break your sampling logic. Improve trace data first, then add sampling.
Prometheus
A time-series database with a nice UI. In this setup, it’s used to store SPM data and monitor Cassandra disk usage — which is critical to keep the server running 24/7.
You need to understand how much telemetry your server can store based on two key metrics: disk size and retention window. This setup handling stably 10k rps with 500 GB of disk and 2-day retention.
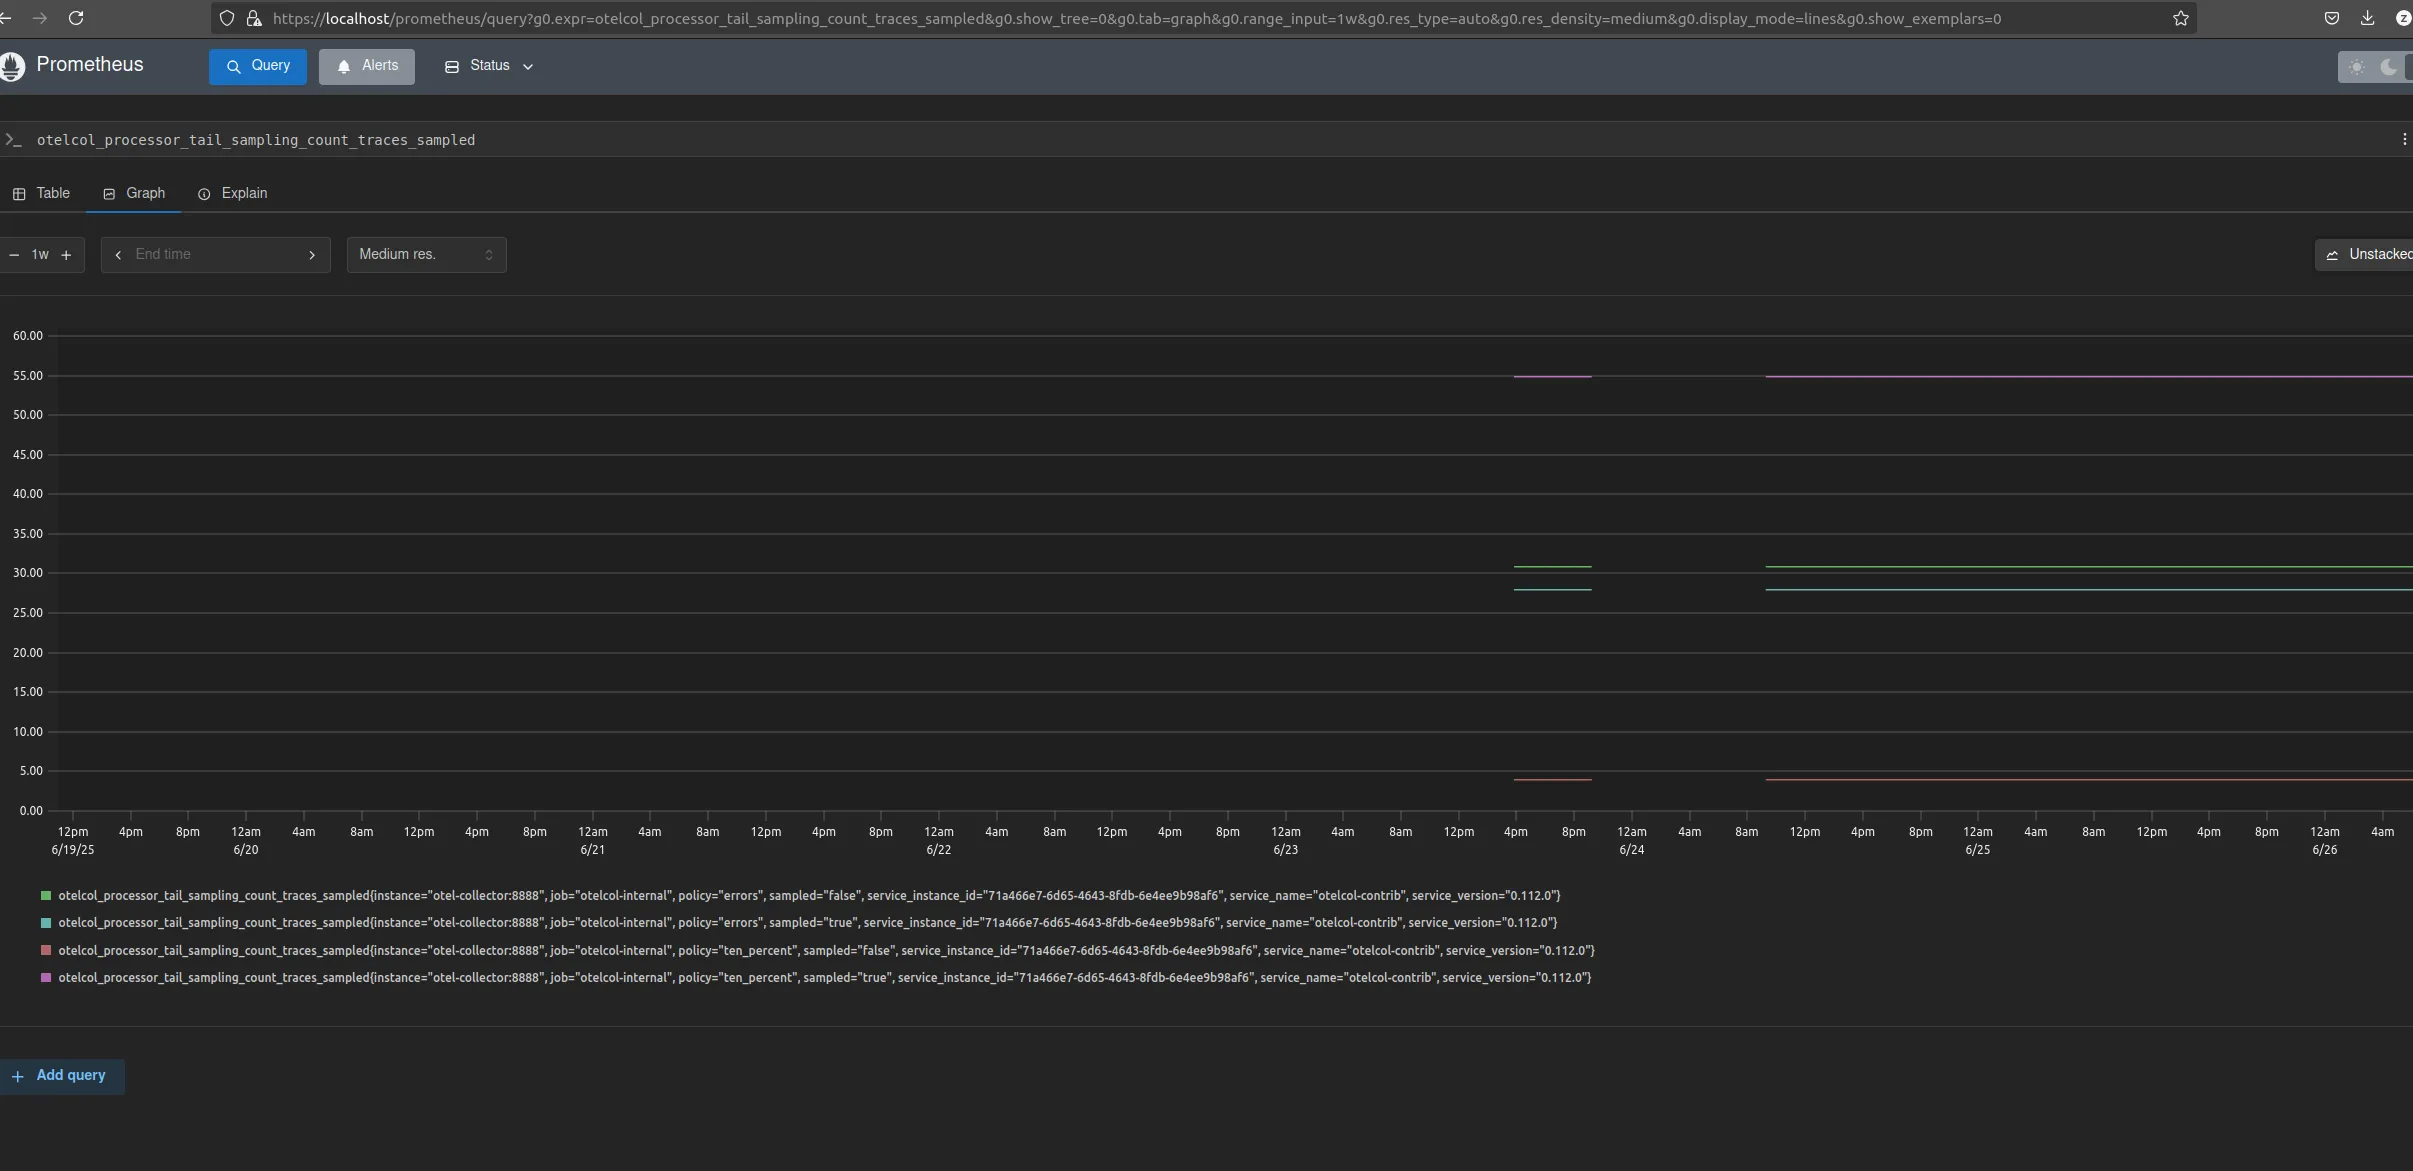
Other important metrics:
Otel Collector sampling metrics (otelcol_processor_tail_sampling*)
These help you understand how many traces were dropped and how the samplers behave.
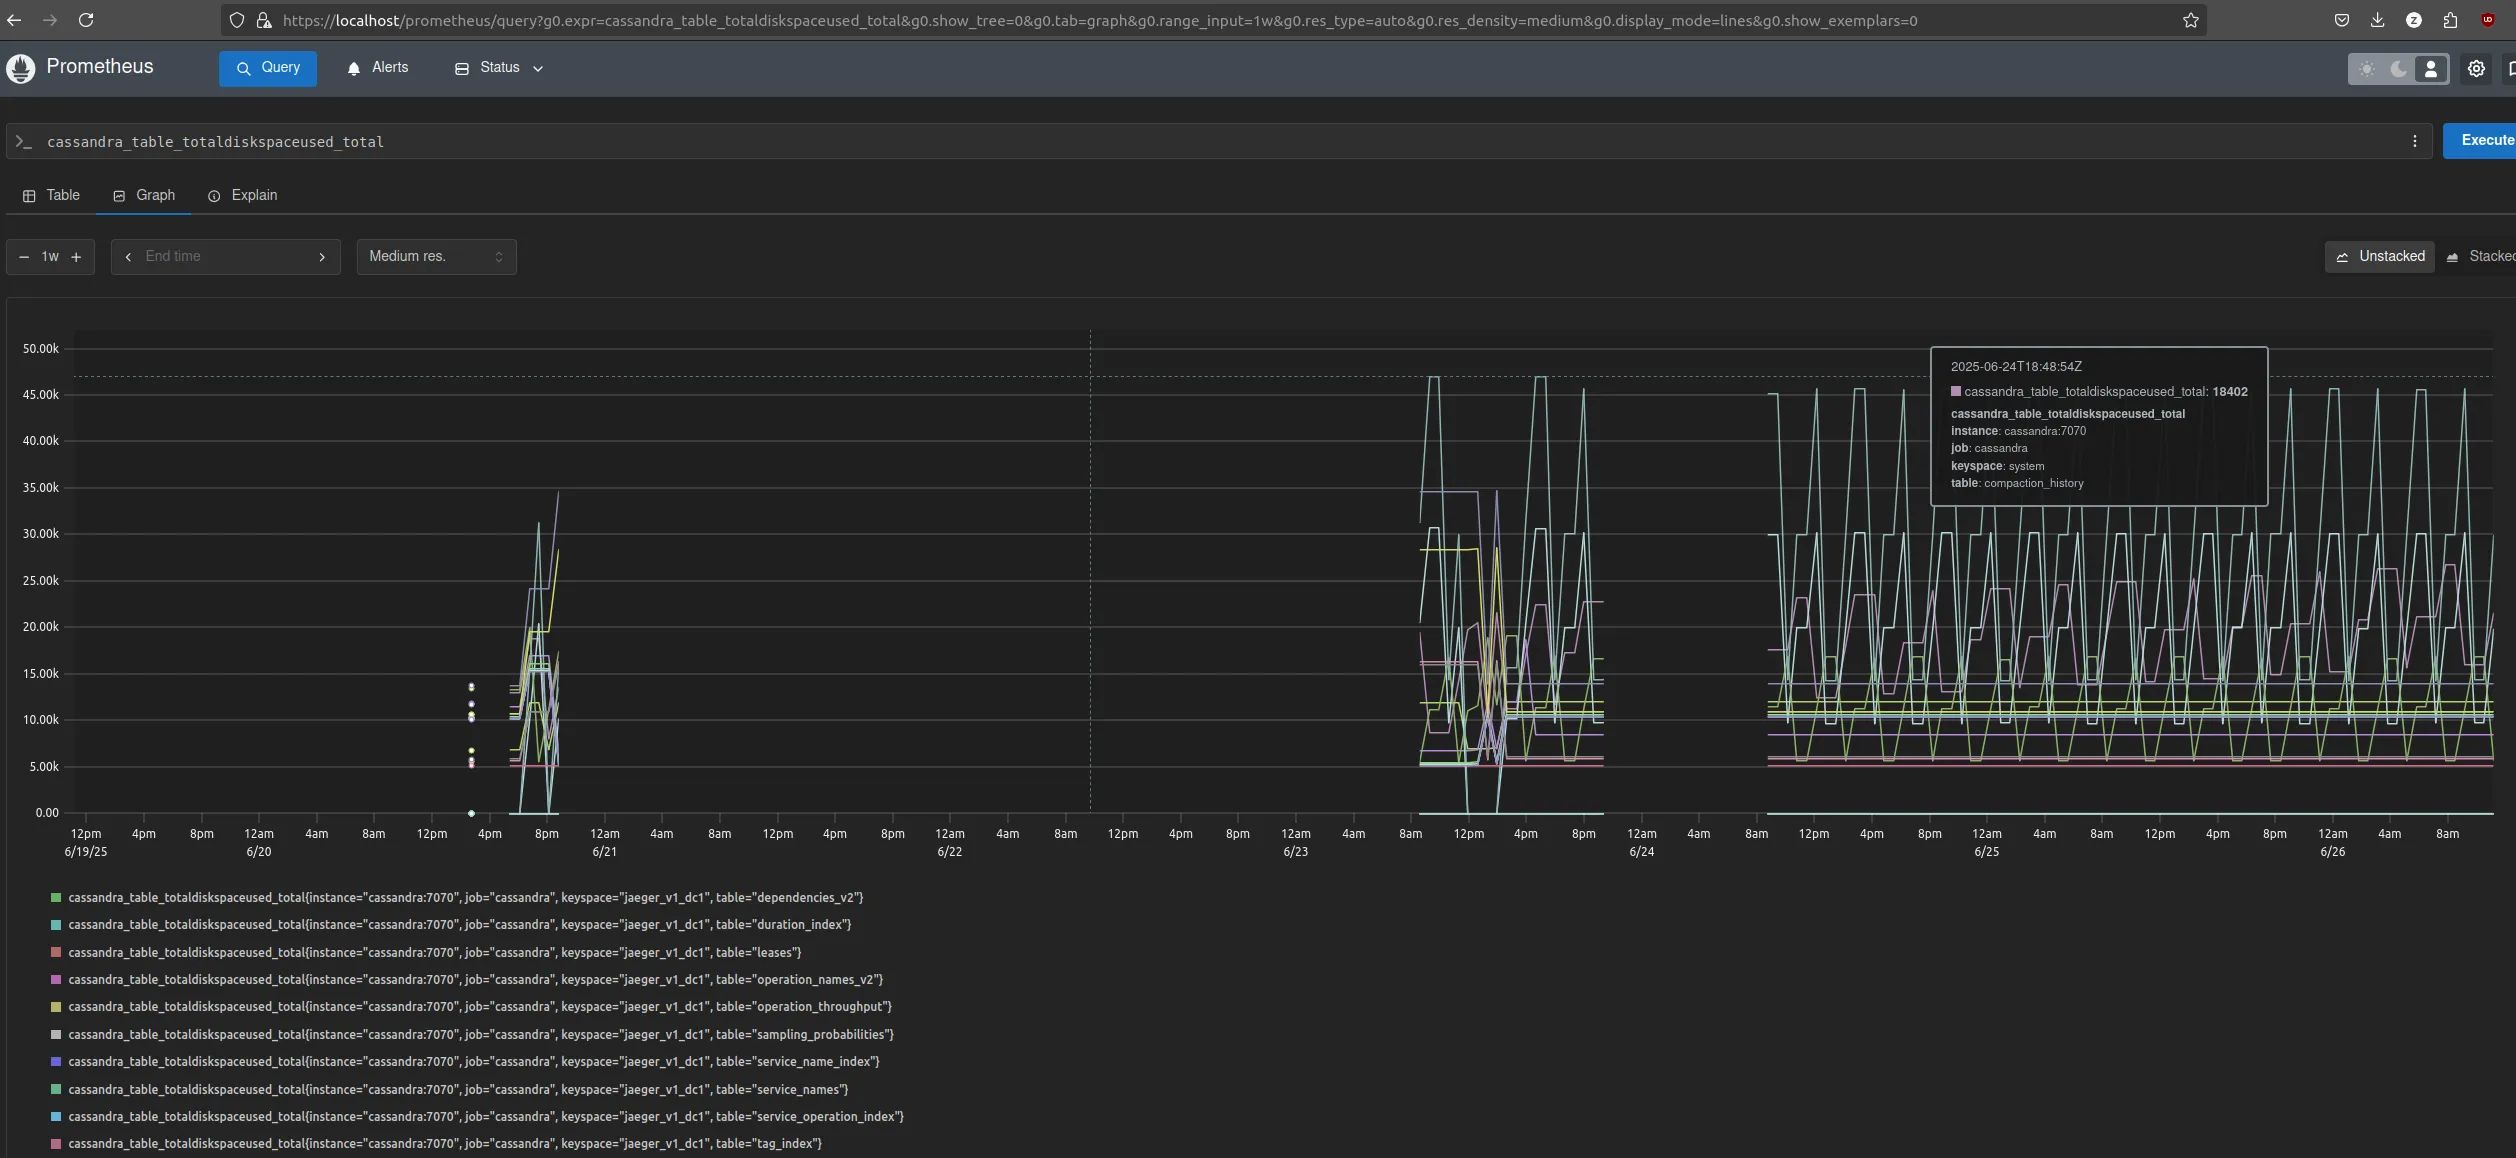
Cassandra metrics (cassandra_*)
Monitor disk usage and storage health.
Cassandra
Main storage for trace data. I included a metrics exporter and a custom logging config to reduce log volume — default Cassandra logging is very noisy.
Cassandra is often used in Jaeger setups because it supports TTL (time-to-live) natively, which makes trace expiration simple and reliable.
Cassandra Schema
A one-time init container. It runs only when the database is empty and initializes the schema for Jaeger.
The default TTL value is set via the docker-compose file to 172800 seconds = 2 days.
CI/CD and Development Recommendations
The deployment pipeline is very simple — I use GitHub Actions and deploy directly to a single VPS.
name: deploy

on:
  push:
    branches:
      - main
  workflow_dispatch:

jobs:
  deploy:
    runs-on: ubuntu-latest
    environment: your_env
    steps:
      - uses: actions/checkout@v4

      - name: Create .env file from secret
        run: echo "${{ secrets.ENV_FILE }}" > src/.env

      - name: Upload infra configs
        uses: appleboy/scp-action@v0.1.4
        with:
          host: ${{ vars.HOST }}
          username: ${{ secrets.USER }}
          password: ${{ secrets.PASSWORD }}
          port: 22
          source: "./*"
          target: /telemetry

      - name: Restart infra
        uses: appleboy/ssh-action@v1.0.3
        with:
          host: ${{ vars.HOST }}
          username: ${{ secrets.USER }}
          password: ${{ secrets.PASSWORD }}
          script: |
            docker compose -f /telemetry/compose.yaml up -d --build
Not exactly kubectl apply, but it’s fast and works 😎
⚠️ Service updates:
This pipeline might not fully update some services if they rely on config files mounted as volumes. To avoid this, I recommend creating custom Dockerfiles (e.g. for Caddy) and embedding configuration files > inside the image itself. That way, any config change will trigger a rebuild and full restart of the affected service.
Security note
This server does not include authentication by default. While telemetry collection endpoints (like /v1/traces) are often open, service dashboards like Jaeger and Prometheus should be protected.
The simplest way is to add Basic Auth via Caddy. I didn’t include it here to avoid storing password hashes in the public repo — but it’s literally a one-line change.
In production, you should integrate this setup with your centralized authentication system (e.g., SSO or LDAP).
Good luck with your first traces!